Sequence and flow diagrams in seconds, checked against your text, on your brand.
Diagrams for Agents now draws sequence diagrams and flowcharts with a deterministic engine: the model only reads your text, and code does the layout and drawing. This page shows what we measured, how, and where we are still behind. Architecture diagrams are not on this engine yet, and we say why below.
6–12 smedian time per diagram, sequence and flowchart (measured, 10 runs per batch, three batches)
$0.015–0.04model cost per diagram at gpt-4.1 prices (measured)
0 / 60runs with a wrong claim (sequence and flowchart, three batches), graded by an independent model
0.5–3 sto read a website's brand: no model call, no cost (7 sites tested)
What is different about how it works
The model never draws. It extracts steps, branches and arrows, each with a quote from your text. Layout is computed, so the same structure always produces the same picture, byte for byte.
Every arrow and step is checked against your text. A second pass confirms each one is supported; anything it cannot support is repaired or dropped, never drawn. If too much would have to be dropped, we draw nothing and say so rather than risk a wrong diagram.
Brand is a parameter. Pass a website address and the diagram is drawn in that site's colours, fonts and corner style, with contrast kept legible.
It runs as an API. Any agent can call it; nothing is drawn by hand per diagram.
Samples (unedited, from the graded runs)
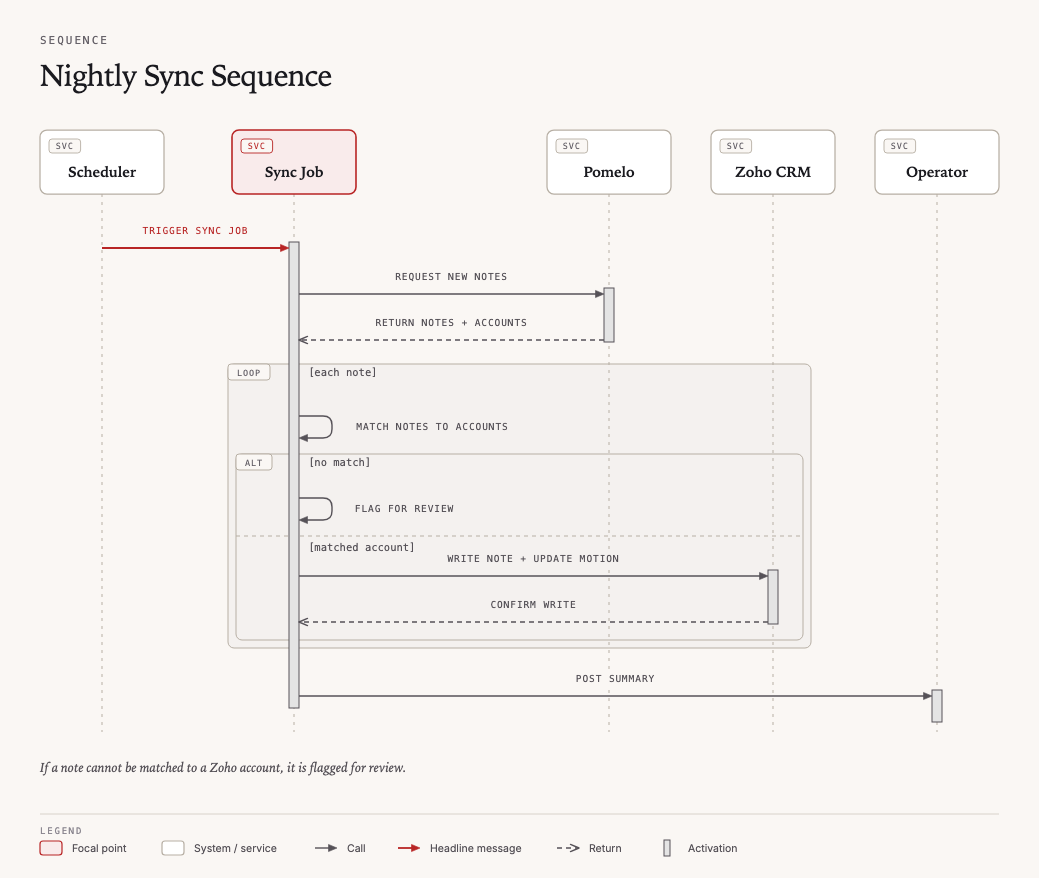
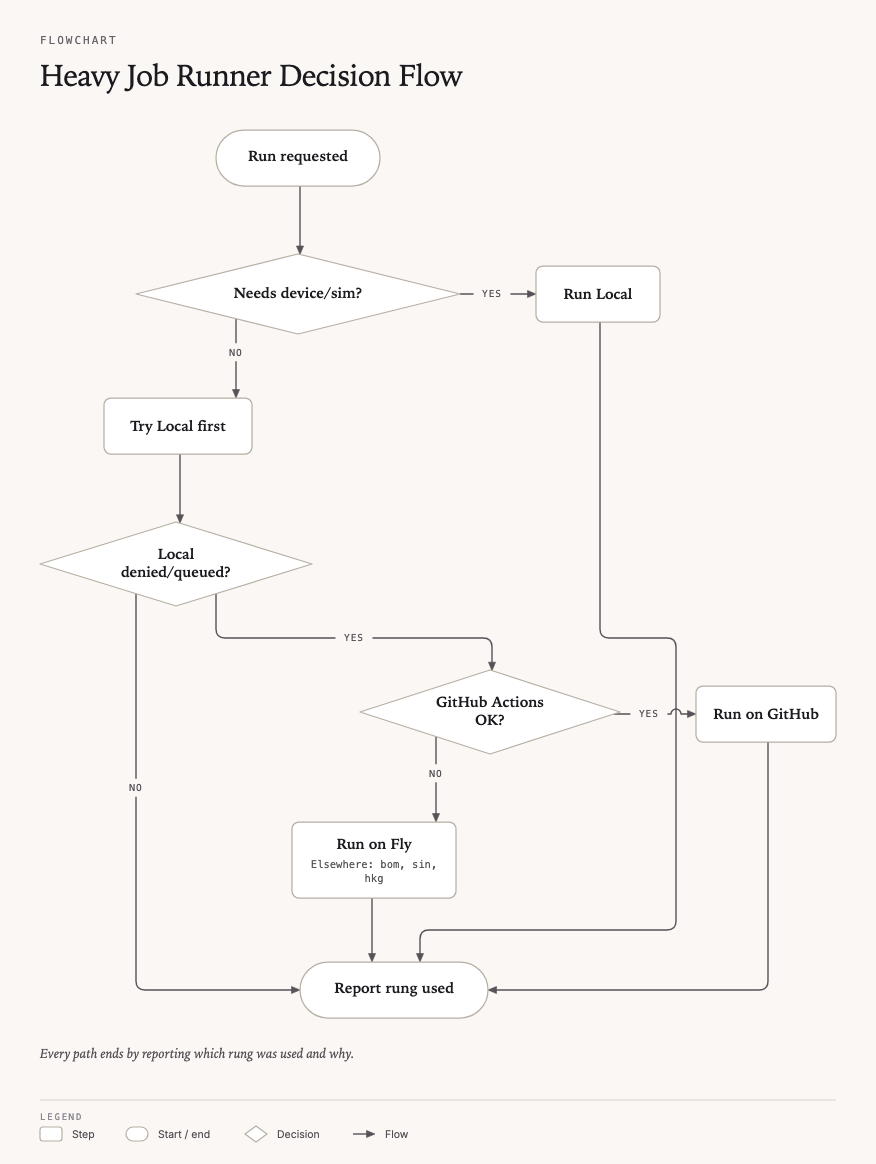
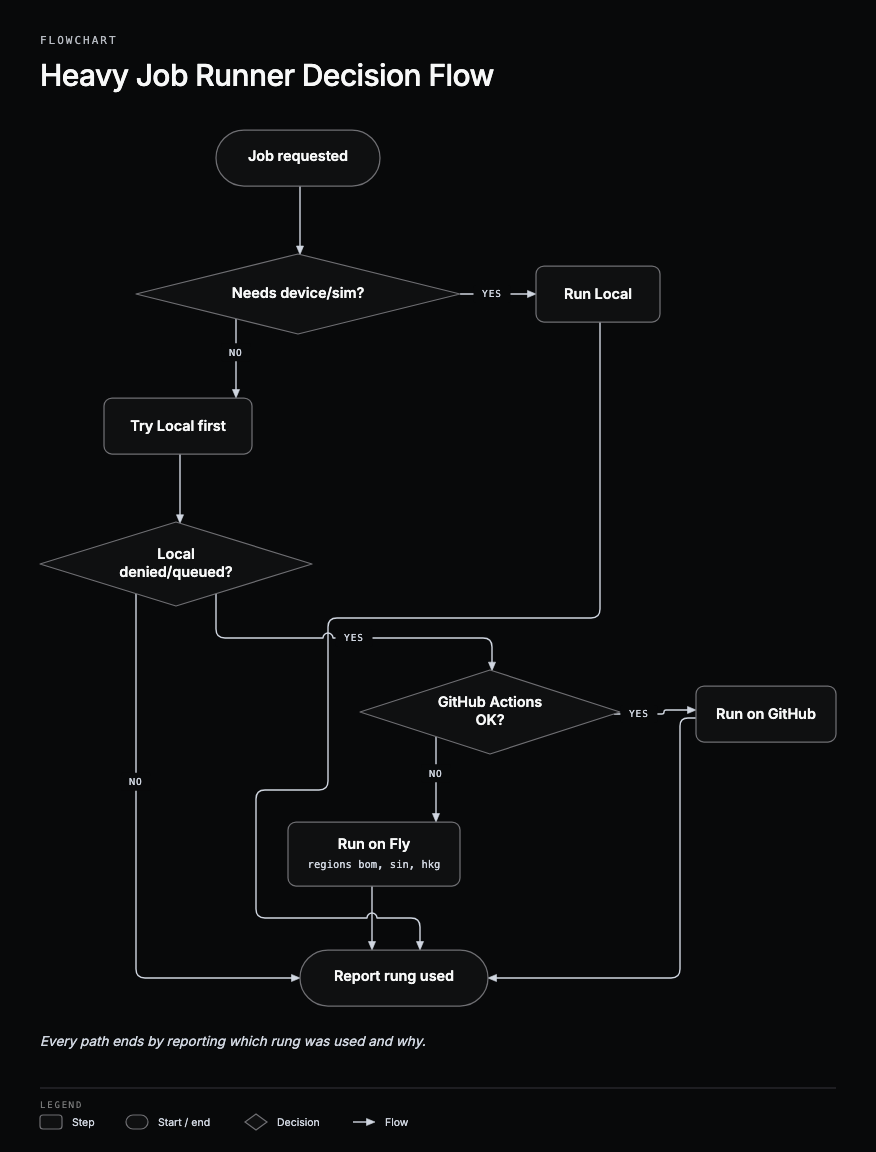
Sequence · default lookFlowchart · default look
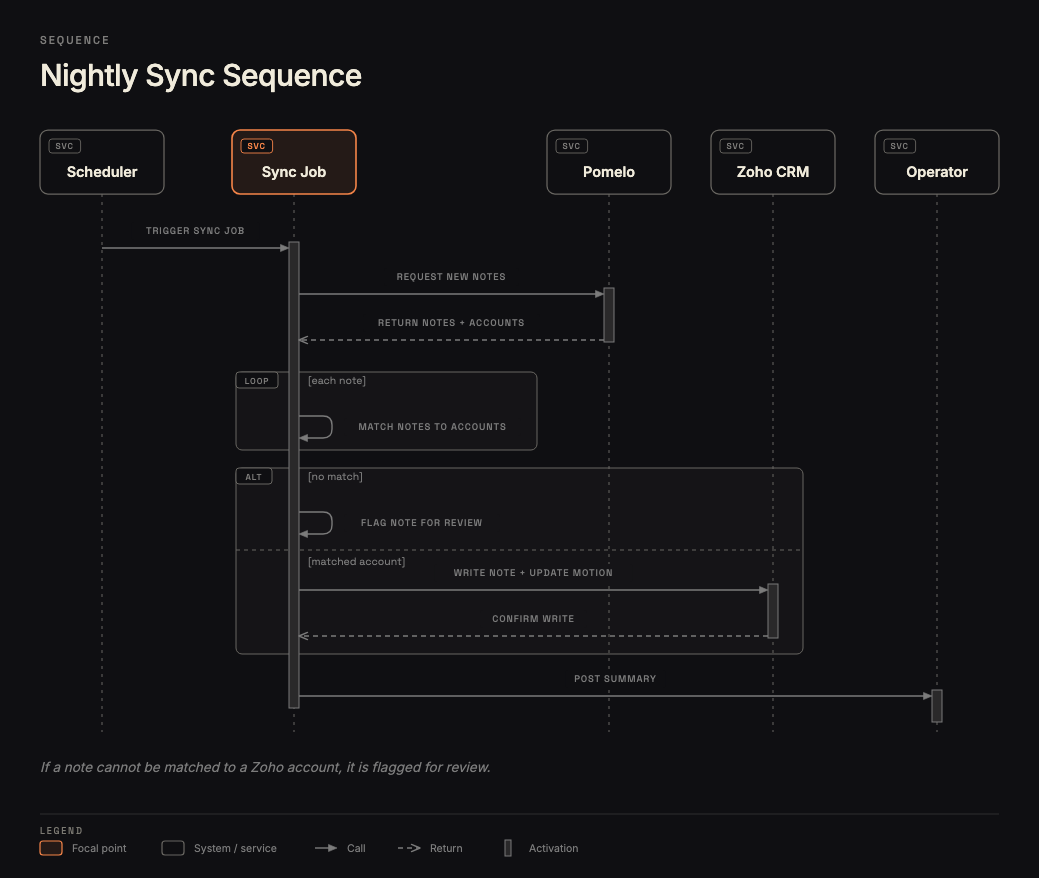
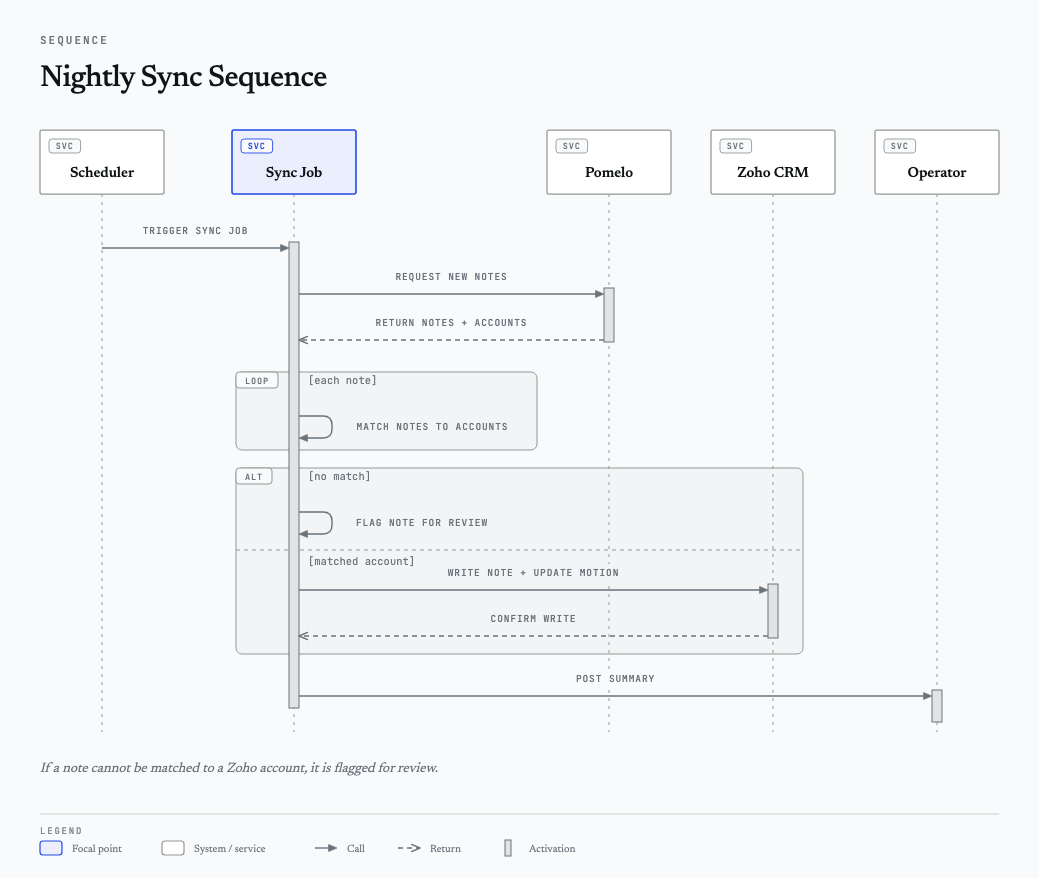
The same diagrams, re-skinned from a website address alone (no model call): a dark brand, a light brand, a second dark brand.
Sequence · brand read from zop.devSequence · brand read from talvinder.comFlowchart · brand read from linear.app
Compared with Diagram Design
Diagram Design (Cathryn Lavery) is a free, open-source skill that has Claude draw each diagram by hand against a style guide. It is good, and it is the standard we compared against. Here is what we measured on comparable inputs.
Measure
Diagrams for Agents
Diagram Design
Confidence
Time per diagram
6–12 s median for sequence and flowchart
about 127 s per diagram on average (one session drawing an architecture, a sequence and a flowchart took about 380 s); one architecture diagram alone about 114 s
Ours measured over 60 runs; theirs single runs, so indicative
Tokens
about 7k for a sequence, about 13k for a flowchart
111,275 for one architecture diagram including loading the skill; 160,818 for all three in one session; about 25k for each further diagram once loaded (inferred)
Measured; different models, so not a price comparison
Wrong claims
0 of 60 runs (sequence and flowchart)
Not measured by us
We did not grade their output for correctness, so we make no correctness claim about it
Same input, same output
Yes, byte-identical for the same structure
Each diagram is drawn fresh, so it can vary run to run
Ours tested; theirs inferred from how it works
Brand from a URL
Yes: deterministic, 0.5–3 s, no cost
Has a brand step that reads a site's colours and fonts
Ours tested on 7 sites
Diagram types
Sequence and flowchart on the new engine, plus 37 business frameworks (SWOT, 2x2, funnel and more)
Up to 41 types, including charts and architecture
From each project's documentation
Where Diagram Design is ahead today.
Architecture diagrams. On the new engine, architecture drew a wrong claim in 3 of 10 runs on our latest measurement, so it is switched off. Until that is fixed, architecture requests use the older path, which often cannot fit complex text. Diagram Design draws architecture diagrams well, with hand-placed, tidy layouts.
It covers more types, imports draw.io, Mermaid and Excalidraw, and is free to install with no API.
When a source is long it drops detail to stay readable; we try to show more of the source, which can make ours denser.
How we tested
Correctness. Three batches of 10 runs each on successive builds, for a sequence input and a flowchart input. A separate model (gpt-4.1) graded every run against a checklist written from the source text, plus structural checks. A wrong claim is anything drawn that the source contradicts. Result: 0 wrong claims in 60 runs; 58 fully correct and 2 incomplete (both flowcharts, one of them refused by the checker rather than drawn wrongly).
Speed and cost. Wall-clock seconds and tokens per run from the same runs, at gpt-4.1 prices of $2 in / $8 out per million tokens (a cheaper model does the checking).
Diagram Design baseline. One fresh run per setup with the default style, timed and token-counted by the agent that ran it. Single runs, not a benchmark.
Reproduce it. The benchmark script and inputs are in the repository (scripts/tech-final.mjs). If you get different numbers, tell us.
What we are not claiming
These are small samples: two inputs. The grader is from the same model family as the extractor. One flowchart in ten can be refused or incomplete.
Architecture is in testing, not released. It reads and draws well most of the time, but we measured wrong claims in 3 of 10 runs on our latest build, so it is off until that reaches zero.
Seven more types (state machine, ER, swimlane, timeline, org chart, dependency graph, deployment) are in testing. On a held-out test, 5 of 210 runs drew a wrong claim, above our bar of zero.
Brand extraction is weak on sites that switch to dark mode with JavaScript after load, and contrast rules can nudge an accent off the exact brand colour.
Speed depends on the model provider; slow API days make our worst case slower.